DACF Home → Bureaus & Programs → Maine Geological Survey → Maps, Publications and Online Data → Using Geologic Maps → Inner Continental Shelf Maps → Sidebar
Sidebar Information Shown on Surficial Geology of the Maine Inner Continental Shelf Maps
Introduction
Geological maps depicting topography, surficial materials, geomorphology, and bedrock play an important role in understanding the origin of, as well as the ongoing processes that shape and change the earth's surface. As in the terrestrial environment, maps are also instrumental in aiding the sound economic development of natural resources. They also provide guidance to natural hazards that exist within the landscape. As people increasingly work on, in, and beneath the sea, the need to better understand regional marine geology, just as we understand terrestrial geology, has grown. This map, and others in this series, are intended to provide a better picture of the northwestern Gulf of Maine. Additional information on specific locations and original field descriptions exists in the associated report: The Seafloor Revealed: The Geology of the Northwestern Gulf of Maine Inner Continental Shelf (Reference 1).
Many reconnaissance surveys of the seafloor of the northwestern Gulf of Maine were conducted in the past decade. Recently that information, along with other previously published data, was compiled in a geographic information system (GIS) to produce this map. The data compiled for this series of maps were originally collected for a variety of research projects, government contracts, and student theses. For this reason there are varying amounts of geophysical data and bottom-sample coverage along the coast rather than a uniform grid. The Seafloor Revealed further explains the field techniques involved in data collection, the nature of the seafloor, the late Quaternary (glacial) geologic history of the Maine coast, previous studies, and sources of other information.
Bedrock geology defines the overall shape of the Maine coastline by controlling the location and orientation of islands, bays, and peninsulas. Bedrock relief is also primarily responsible for the variability in water depths of the inner shelf. Glacial deposits mantle the underlying bedrock and add complexity to regional geomorphology in forms that range from coarse ridges of boulders to basins filled with fine mud. Thick accumulations of glacial sediments (gravel, sand, and mud) often result in smoother areas of seafloor with less bathymetric relief. Almost all of the Holocene (post-glacial) sedimentary material along the coast and offshore is derived from erosion and reworking of glacial deposits. Physical oceanographic processes, including waves and tides, continue to reshape the seafloor sediments and create productive marine habitats of the Gulf of Maine.
Sea-level change has had a profound effect on the location and duration of sediment reworking and deposition. During the complex changes of sea level over the last 14,000 years, coastal and terrestrial erosion stripped muddy glacial sediment from shoals and transferred the material to deeper basins. During deglaciation, the sea covered most of the coastal lowlands of Maine (Reference 2). A regression (sea-level lowering) until about 10,500 years ago was followed by a transgression (rising) that is still continuing (Reference 3 and 4). Areas shallower than the maximum lowering of the sea (less than about 60 m (200 feet) water depth) are generally rockier than deeper regions. The shallower zone lost some of its sediment cover through wave reworking during both the late Pleistocene fall and the early Holocene rise of the sea. These areas also experienced at least a thousand years of subaerial erosion by rivers and streams. The marine geology of the Maine coast records these and many other changes that have taken place since glaciers retreated inland and the sea invaded the western Gulf of Maine (Reference 4, 5, and 6).
Methods
Navigation and Map Compilation
Navigation fixes in the outer estuaries and offshore areas were made at 2 to 5 minute intervals with LORAN-C, which provided an accuracy of +/- 100 m (330 feet). In the upper reaches of the estuaries, radar and line-of-sight observations on buoys and landmarks provided navigational accuracy that varied from less than +/- 10 m (33 feet) to around +/- 200 m (660 feet). Recent work used the global positioning satellite system (GPS) for navigation and was accurate to +/- 10 m (33 feet). All navigation was converted to Universal Transverse Mercator projection and plotted with a geographic information system (GIS).
Surficial geologic maps were prepared in six steps:
- use a GIS to plot the geophysical tracklines, bottom sample locations, and bathymetry on large-scale maps,
- interpret sonar records and geology based on other geophysical data and samples,
- digitize the drafted interpretation into a GIS,
- compile and edit the digital data to generate map polygons,
- check the mapped geology, and
- assemble the final product including geology, bathymetry, geographic names, and roads. The shoreline and roads are from the U.S. Geological Survey's 1:100,000 Digital Line Graph files.
Bathymetry
Bathymetry was digitized at a 10 m contour interval from preliminary National Ocean Service (NOS) Bathymetric and Fishing Maps at a 1:100,000 scale. The NOS bathymetric maps provide a 2 m contour interval in many locations that is too complex for inclusion on this map. Difficulty in interpretation of positive and negative changes in bathymetry on the poorly labeled NOS maps created many possible errors, especially in areas where accompanying geophysical data were lacking. For this reason, these maps should not be used for navigation. More detailed and accurate NOS conventional nautical charts should be used for navigation.
Bottom Samples
Between 1984 and 1991, 1,303 bottom sample stations were occupied (see the Features and Data Source Map for locations in this region). Two attempts were made at each station where the sampler initially returned empty, after which the site was considered a rock bottom. A Smith-McIntyre stainless steel grab sampler was used that nominally collected up to 0.016 cubic meters (0.5 cubic feet) of sediment. Southwest of Cape Small, samples were generally collected in a grid pattern with a 2 kilometer (1 nautical mile) distance between sample sites. Focus was placed on the large sandy embayments off Wells, Saco, and the Kennebec River mouth, as well as on muddy Casco Bay. Relatively few bottom samples were gathered off rocky areas such as Kennebunk or Kittery. Geophysical tracklines were later run over the sample stations to permit extrapolation of the bottom-sediment data. North and east of Cape Small, geophysical data were generally gathered before bottom samples. This resulted in a need for fewer samples, and so fewer stations were occupied. Following collection, samples were stored in a freezer in the sedimentology laboratory at the University of Maine. Depending on the level of funding or specific needs of a particular project, samples were analyzed for grain size, organic carbon and nitrogen, carbonate content and/or heavy minerals (see Table 1 of Reference 1).
Side-Scan Sonar Profiles
Analog side-scan sonar records along 3358 km (1800 nmi) of the seafloor were gathered with an EG&G Model SMS 260 slant-range corrected sonar operating with a Model 272-T towfish at a nominal frequency of 105 kHz. The device was most often run at a 100 m (330 ft) range for each channel (200 m wide swath beneath the research vessel), although ranges from 25 to 300 m (80 to 1000 ft) were occasionally employed. The swaths of directly imaged and interpreted seafloor areas are depicted in brighter colors on the map. See the Surficial Geology Legend in the lower left corner of the map and the Interpretation of Side-Scan Sonar Images for further details.
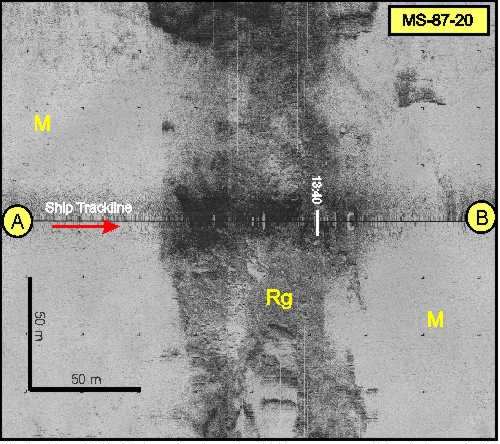
Figure 1. Side-Scan Sonar Profile The image above is a portion of a side-scan sonar record taken simultaneously with the seismic reflection profile to the left (Figure 2). This image shows a plan view of the seafloor (much like an aerial photograph). The area shown is about the size of eight football fields. The darker area is a mixture of bedrock outcrop and gravel (Rg). The lighter areas on either side are flat, muddy seafloor (M). The ship track followed the black centerline over the bottom. Both of these images were made using sound waves.
Seismic Reflection Profiles
Seismic reflection profiles were gathered along 5011 km (2700 nmi) of tracklines, often in conjunction with side-scan sonar data (see simultaneous seismic and side-scan images above). A Raytheon RTT 1000a 3.5/7.0 kHz unit with a 200 kHz fathometer trace was used mainly in relatively shallow water (0 to 50 m; >165 ft) over muddy bottoms. An ORE Geopulse "boomer" (0.5 to 200 kHz) seismic system was most effective in deeper water (15 to 150 m; 50 to 500 ft) over thicker deposits of sandy or gravelly sediment. Although seismic reflection profiles are most useful in constructing the geological history of an area, the bathymetry and stratigraphic context they provide, along with the strength of the surface return, also help identify the seafloor type (Reference 6). When used in conjunction with the side-scan sonar data, both the age and nature of the surficial sediment are easily interpreted.
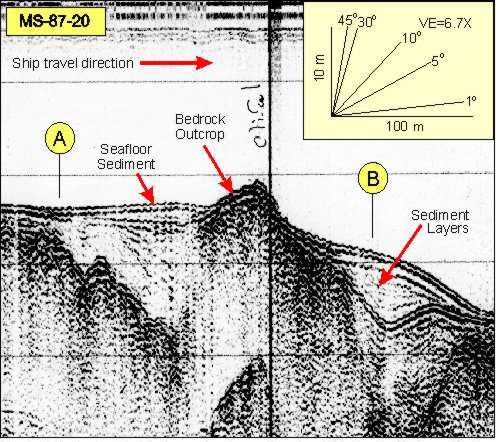
Figure 2. Seismic Reflection Profile The image above is a portion of an ORE seismic reflection profile from Muscongus Bay and shows a cross-section (side view) of the seafloor. The seafloor surface shape is analagous to a fathometer profile. A vertical exaggeration (VE) of 6.7 makes all slopes appear steeper than they really are. The subsurface reflectors are from sediment layers and buried bedrock surfaces. Positions A and B correspond to the same locations in both figures. A time mark is shown by the vertical line at 13:40.
Surficial Geology
Introduction
The surficial materials of the inner continental shelf of the northwestern Gulf of Maine are the most complex of any place along the Atlantic continental margin of the United States. Igneous, metamorphic, and sedimentary rocks spanning hundreds of millions of years of earth history form the regional basement. Glacial deposits, containing all clast sizes from boulders to mud, partially mantle the rocks. These materials, in turn, have been reworked by coastal processes during extreme fluctuations of sea level over the past few thousand years to create better-sorted modern deposits (Reference 5). Biological processes, including shell formation, bioturbation, and organic matter cycling have also altered the sediment composition and left geological imprints on the seafloor (Reference 7 and 8). In addition to the surficial geology of this map, the geomorphology of the seafloor has also been mapped. The Physiographic Map of the Maine Inner Continental Shelf (Reference 9) shows the geomorphology of the offshore region covered by this series of surficial geologic maps in a single, smaller scale map.
Rocky Areas
Rocky seabed occupies approximately 41% of the inner continental shelf and is the most abundant seafloor type in this map series. Where little data exist and the seafloor relief is very irregular, a rocky bottom was inferred. By this inference, large areas of rocky bottom were mapped off extreme southern Maine, Penobscot Bay, and Petit Manan Point. Large areas of rock also occur surrounding the many granitic islands in Blue Hill and Frenchman Bays. Elongate, submerged rock ridges follow the linear trend of the Casco Bay peninsulas. Although common as nearshore shoals in water less than 10 m (33 ft) deep, large outcrops of rock are relatively rare in deep offshore basins.
The bedrock geology was not determined, but side-scan sonar images clearly depict parallel fractures and elongate outcrop patterns common in layered metamorphic rocks as well as more rounded bodies of rock often associated with plutonic (granitic) igneous rocks (Reference 10). In shallow water, rock outcrops are usually covered with algae (seaweed) and encrusting organisms. Below water depths of a few tens of meters (the photic zone), encrusting organisms and organic mats often cover bedrock outcrops. "Rock greater than mud" (Rm; for an explanation of abbreviations see Interpretation of Side-Scan Sonar Images) is most common in deep offshore basins where outcrops project up through the mud that mantles the seafloor. Rm also occurs as small areas seaward of tidal flats in nearshore basins. "Rock greater than sand" (Rs) exists only in a few locations offshore of beaches.
Areas adjacent to rock outcrops are commonly covered with shells of dead organisms. Formerly attached to the rock surface, these shelly remains are mixed with angular rock fragments that have fallen off the outcrop (Reference 8). Bedrock fractures and troughs also have a similar mixture of shell and rock clasts. For this reason, extensive, "pure" rock outcrops were infrequently mapped. Instead, fractured bedrock and small bodies of rock were most often mapped as "rock greater than gravel" (Rg) or "gravel greater than rock" (Gr), two of the most common seafloor types observed.
Gravelly Areas
Gravel is a common constituent of inner shelf sediment, but occupies only 12% of the seafloor itself. Gravel is abundant in only a few locations: off the Kennebec River mouth where deltaic sediments are exposed, off Wells and Saco Bays near reworked glacial moraines, and near the Canadian border. Frequently the gravel has a rippled surface, and may contain minor amounts of coarse sand. In areas where waves regularly scour the seabed, a gravel lag deposit armors the seafloor. Gravel also occurs in broad linear bands near submerged moraines.
As described above, "gravel greater than rock" (Gr) is a common feature adjacent to bedrock outcrops. Here the gravel may have a high shell content (calcium carbonate) because shells are often the only modern sediment introduced to an area. Gr and "gravel greater than sand" (Gs) are major features of the seafloor from the Canadian border to Englishman Bay. Here, low-relief bedrock is mantled by till, which fills in rock depressions but lacks much relief itself. "Gravel greater than mud" (Gm) is very rare along the inner shelf. Gravel and mud are not deposited in the ocean under the same hydrodynamic conditions, but may be found just beneath the seafloor in till deposited by glaciers more than 13,000 years ago beneath glacial ice.
Sandy Areas
Sandy seafloor (S) occupies only 8% of the inner shelf of the northwestern Gulf of Maine. The sandiest regions are offshore of southern Maine beaches such as Old Orchard and Ogunquit. In the mid-coast region, a large sandy area "sand greater than gravel" (Sg) occurs off the Kennebec River mouth. This Sg area, consisting of many small rippled gravel patches that are intermingled with sand, has not changed appreciably in a decade, although large winter storms resuspend sand and gravel in water depths down to at least 55 m (180 ft). Many smaller bodies of sand are scattered elsewhere throughout the coast, occasionally around the 50 to 60 m (165 to 200 ft) depth, near the lowest stand of sea level since the Ice Age.
Sandy material is acoustically uniform and strongly contrasts with bordering areas of gravel and rock. Although many sediment samples from shallow water contain well-sorted ("clean") sand, areas mapped "sand" or sand with other materials frequently contain sediment in which the sand is mixed with mud, gravel and a variety of shell fragments.
"Sand greater than rock" (Sr) is a minor component of the seafloor that exists adjacent to small bedrock outcrops scattered across the mapped area. It is possible that more Sr areas exist, especially in the southern shelf, but few observations were made in that region. "Sand greater than mud" (Sm) is a very difficult unit to map because mixtures of mud and sand look similar on acoustic images. The only mapped areas of "sand greater than mud" are located in Saco Bay, where bottom samples confirmed the presence of both particle sizes. Similar occurrences of Sm may occur at the seaward margin of other beaches.
Muddy Areas
Muddy regions cover 39% of the seafloor and are the second most abundant surficial material. Mud is the dominant seabed material in all nearshore areas except for southern Maine and near the Canadian border. It is also the major deep-water surficial material in all locations except off the southern Maine coast.
Mud accumulates near areas where there is an available supply of fine-grained sediment and there are quieter hydrodynamic conditions, which favor the slow settling of small particles, or their entrapment by organisms. In nearshore regions, mud comes from eroding glacial bluffs and seasonally from rivers. In deep water, mud must be derived from winnowing and erosion of deposits in shallow water.
Muddy seafloors are featureless on acoustic records unless they have been disturbed or contain anomalous "hard" objects. Drag marks left by fishing gear are common in most sedimentary environments, but are most noticeable when carved into mud. Gas-escape pockmarks are generally hemispherical depressions that result from localized seabed disturbance. Where pockmarks occur in abundance, the seafloor is uneven. Thousands of pockmarks hundreds of meters (yards) in diameter and tens of meters (yards) deep make crater-like terrain in the muddy bottom in Belfast, Blue Hill, and Passamaquoddy Bays (Reference 7 and 8).
"Mud greater than rock" (Mr) occurs in some deep-water locations, but "mud greater than gravel" (Mg) is as rare as "gravel greater than mud" (Gm) because of the hydrodynamic differences between the sizes of materials. "Mud greater than sand" (Ms) occurs seaward of the sandy area of Saco Bay and is mapped on the basis of a large number of bottom samples that encountered this mixture in this region.
References Cited
(1) Kelley, J. T., Barnhardt, W. A., Belknap, D. F., Dickson, S. M., Kelley, A. R., and Ward, L., 1996, The seafloor revealed: the geology of the northwestern Gulf of Maine inner continental shelf, Maine Geological Survey, Natural Resources Information and Mapping Center, Open-File Report 96-06.
(2) Thompson, W. B., and Borns, H. W., Jr., 1985, Surficial geologic map of Maine: Maine Geological Survey, 1:500,000 scale.
(3) Barnhardt, W. A., Gehrels, W. R., Belknap, D. F., and Kelley, J. T., 1995, Late Quaternary relative sea-level change in the western Gulf of Maine: evidence for a migrating glacial forebulge: Geology, v. 23, p. 317-320.
(4) Belknap, D. F., Shipp, R. C., Stuckenrath, R., Kelley, J. T. and Borns, H. W., Jr., 1989, Holocene sea-level change in coastal Maine, in Anderson, W. A., and Borns, H. W., Jr. (editors), Neotectonics of Maine; Studies in seismicity, crustal warping, and sea-level change: Maine Geological Survey, Bulletin 40, p. 85-103.
(5) Kelley, J. T., Dickson, S. M., Belknap, D. F., and Stuckenrath, R., Jr., 1992, Sea-level change and late Quaternary sediment accumulation on the southern Maine inner continental shelf, in Fletcher, C. H., III, and Whemiller, J. F. (editors), Quaternary coasts of the United States: marine and lacustrine systems: Society of Economic Paleontologists and Mineralogists, Special Publication No. 48, p. 23-34.
(6) Belknap, D. F., Shipp, R. C., Kelley J. T., and Schnitker, D., 1989, Depositional sequence modeling of Quaternary geologic history, west-central Maine coast, in Tucker, R. D., and Marvinney, R. G., (editors), Studies in Maine geology, Volume 5 - Quaternary geology: Maine Geological Survey, p. 29-46.
(7) Kelley, J. T., Dickson, S. M., Belknap, D. F., Barnhardt, W. A., and Henderson, M., 1994, Giant sea-bed pockmarks: evidence for gas escape from Belfast Bay, Maine: Geology, v. 22, p. 59-62.
(8) Barnhardt, W. A., and Kelley, J. T., 1995, Carbonate accumulation on the inner continental shelf of Maine: a modern consequence of late Quaternary glaciation and sea-level rise: Journal of Sedimentary Research, v. A65, p. 195-207.
(9) Kelley, J. T., Dickson, S. M., Barnhardt, W. A., Belknap, D. F., and Kelley, A. R., unpublished, Physiographic map of the Maine inner continental shelf: Maine Geological Survey.
(10) Osberg, P. H., Hussey, A. M., II, and Boone, G. M., 1985, Bedrock geologic map of Maine: Maine Geological Survey, scale 1:500,000.
Acknowledgements
Funding for this compilation was provided by the Regional Marine Research Program of NOAA (Grant # NA46RM0451). We wish to thank Mr. Walter A. Anderson, former Director of the Maine Geological Survey, for more than ten years of unrelenting encouragement and support for our offshore research. In addition, we thank Dr. Robert E. Wall who directed the University of Maine Center for Marine Studies, which partly purchased the geophysical equipment and GIS used for this compilation. Most of the data collection was sponsored by the Maine-New Hampshire Sea Grant Program, the Continental Margins Program of the Minerals Management Service and Association of State Geologists, the National Science Foundation, the Nuclear Regulatory Commission, the Environmental Protection Agency, the National Undersea Research Program, and the Maine Department of Marine Resources. We acknowledge many graduate students who assisted in the original collection and interpretation of much of the data, especially Dr. R. Craig Shipp. Finally, we acknowledge the able seamanship of Captain Michael Dunn, formerly of the Darling Marine Center, who participated in all bottom sampling and most geophysical expeditions.
Last updated on January 26, 2015