Home → For Libraries → Public Value → Summary of Chapter 2: Who Are the Library’s Financial Supporters?
Summary of Chapter 2: Who Are the Library’s Financial Supporters?
This chapter describes the three major voting segments and the percentage of each segment which will definitely vote “YES” for funding libraries. These segments are shown in Chart 1 below. It also provides considerable demographic data on each segment. The major segments are: (From Awareness to Funding, p. 2-4 & 2-5).
-
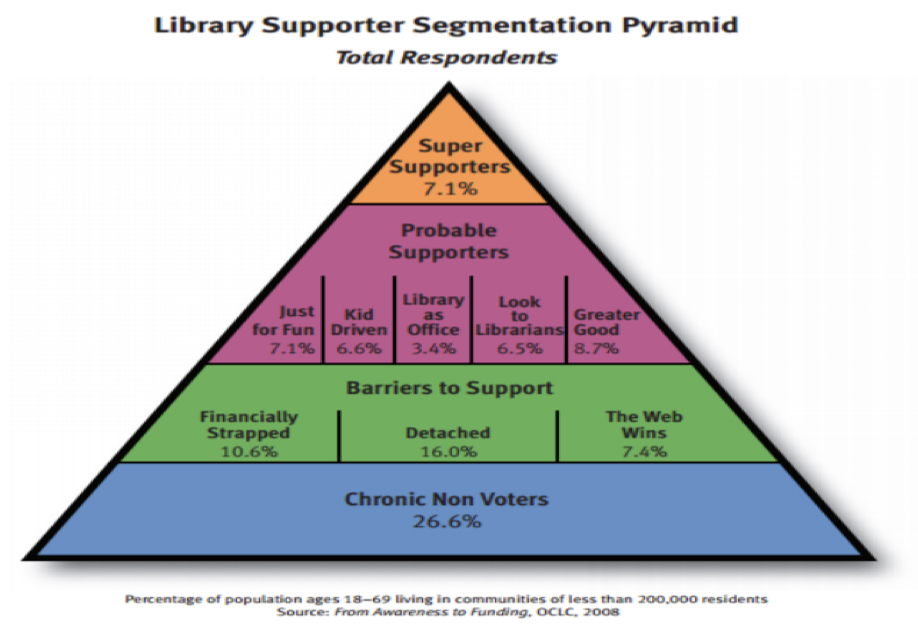
Chart 1. Library Supporter Segmentation Pyramid (From Awareness to Funding, p. 2-8) Super Supporters: This small group (10%1 of the likely voters) are the most likely to vote YES on library funding referendums.
- Probable Supporters: This group (44% of likely voters) has “the potential to be persuaded to increase their commitment to voting favorably for a library referendum.”
- Barriers to Support: This group (46%) has significant barriers to supporting the library financially but the report estimates that 19% of this group will definitely vote YES. Given their size, this means that more of the YES vote comes from this group than the “Super Supporters” who will vote YES 80% of the time.
- Chronic Non Voters: This group (26% of the total respondents but 0% of the likely voters were defined as people who are not registered to vote or who say they are unlikely to vote in the future.
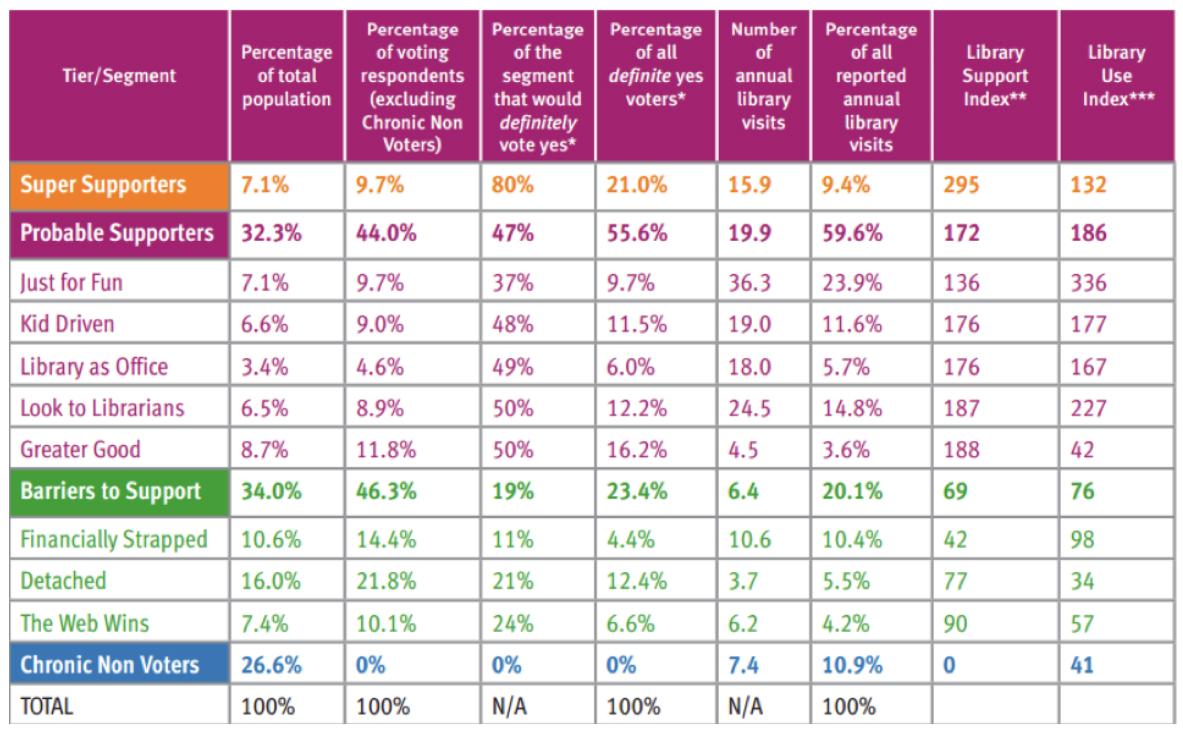
The two middle segments were further sub-divided into eight groups. Details on these are provided in Table A1 below.
“Probable Supporters” were divided into the following five voter segments.
- “Just for Fun”: This group are the heaviest users of the library, particularly for recreational reading and services and contributed about 10% of the YES vote, compared to 21% of the YES vote by Super Supporters who also are the same size but use the library less than half as much. Their definite YES vote reflects only 37% of this group, leaving lots of room for a strong response. (From Awareness to Funding, pp. 2-43 to 2-51).
- “Kid Driven”: This group participates in children’s programs and checks out kid’s materials. While only 9% of the likely voters, they provide 11.5% of the definite YES vote. Surprisingly, this represents only 48% of this segment that would definitely vote YES. (From Awareness to Funding, pp. 2-52 to 2-59).
- “Library as Office”: This small group (5% of likely voters) uses the library as an office, especially when they operate a business in the town or work for one in town. While about half (49%) will definitely vote YES for library funding, this is only 6% of the definite YES vote. (From Awareness to Funding, pp. 2-60 to 2-68).
- “Look to Librarians”: This group is about the same size as the Kid Driven group but slightly more likely to definitely vote YES (50% vs. 48%). The report characterizes the group as follows:
“The Look to Librarians segment has a deep appreciation of the value of the librarian in providing services and research expertise. Its members also believe that the librarian is a passionate advocate for the library within the community. Look to Librarian voters give librarians the most favorable rating of any segment.
“Look to Librarian respondents are more likely than other segments to be female (65%), Hispanic (20%) and have children (45%). They also show a tendency to be in the lower-middle-income bracket and to be part-time college students.” (From Awareness to Funding, pp. 2-69 to 2-78).
- “Greater Good”: This group visits the library infrequently but these library supporters believe the library is important for the community and for community pride. These types of in-direct benefits, ones that accrue to people who are not library patrons as well as for patrons, are called “public value” by public sector economists. This group borrows more books than average, uses fewer of the other library services less than other groups, and is active in community organizations. (From Awareness to Funding, pp. 2-79 to 2-86).
“Barriers to Support” voters are 46% of the likely voters — about the same size as the “probable supporters.” However, only 19% of “barriers to support” voters are likely to definitely vote for additional library funding, compared to 47% for the “probable supporters,” However, 23% of those who will “definitely vote yes” come from this group. This category is divided into the following three groups:
- “Financially Strapped”: This segment has about 14% of all likely voters and only 4% of those who definitely vote for additional funding. (From Awareness to Funding, pp. 2-14 to 2-21).
- “Detached”: These voters are not active in their communities or users of the library. While they have higher incomes than average, they do not follow local events and hence the label “detached.” This is a very interesting group because it comprises 22% of the likely voters. However, it also has about 12% of those who will definitely vote yes which is higher than four out of five of the groups in “probable supporters.” The difference is that the probability of any one of these detached voters providing support is less than half that of four out of five. (From Awareness to Funding, pp. 2-22 to 2-30).
- “The Web Wins”: As the label implies this is the group that believes libraries are no longer necessary due to the resources available online. While a low percentage of this group can be counted on as definitely voting yes, they do provide almost 7% of the positive vote. (From Awareness to Funding, pp. 2-31 to 2-37).
Table A1: Segmentation Data Summary
Implications for Local Libraries
- The authors claim the segments provide a framework for defining messages for advocacy campaigns on a capital campaign, building referendum, or even long term support of operating budgets. The way they use these can be seen in the follow-up report entitled: “Geek the Library: A Community Awareness Campaign” by Online Computer Library Center, 2010.
- While the methodology is not directly presented it is possible to reverse engineer it if a community wished to replicate this type of survey and identify individuals related to each segment. However, this would need to be started at least two to three years prior to the referendum and would require some professional assistance and time.
1 I have rounded these to the closest full percentage point.
