Home → For Libraries → Public Value → Summary of Chapter 4: Library Funding Support Is an Attitude, Not a Demographic
Summary of Chapter 4: Library Funding Support Is an Attitude, Not a Demographic
The key findings from the survey’s quantitative results were:
- “Most people claim they would support the library at the ballot box — fewer are firmly committed to it.
- There is a lot that people don’t know about their public library.
- Library support is only marginally related to visitation. Advocating for library support to library users focuses on effort and energy on the wrong target groups.
- Perceptions of the librarian are highly related to support. “Passionate librarians” who are involved in the community make a difference.
- The library occupies a very clear position in people’s minds as a provider of practical answers and information. This is a very crowded space, and to remain relevant in today’s information landscape, repositioning will be required.
- Belief that the library is a transformational force in people’s lives is directly related to their level of funding support.
- Increasing support for libraries may not necessarily mean a trade-off of financial support for other public services.
- Elected officials are supportive of the library — but not fully committed to increasing funding. Engaging Probable Supporters and Super Supporters to help elevate library funding needs is required.” (From Awareness to Funding, p. 1-6)
Discussion
Each of these is very briefly discussed below.
Point 1: Their findings show that 74% claim they will vote for library funding but that only 37% are definite YES voters, with another 37% open to vote YES with some persuasion, and 26% likely to vote NO. (From Awareness to Funding, pp. 4-2 & 4-3)
Point 2: Interestingly, the authors conclude that the lack of awareness of all library services “may not be a deterrent for funding support,” at least for the top supporters. (From Awareness to Funding, p. 4-4)
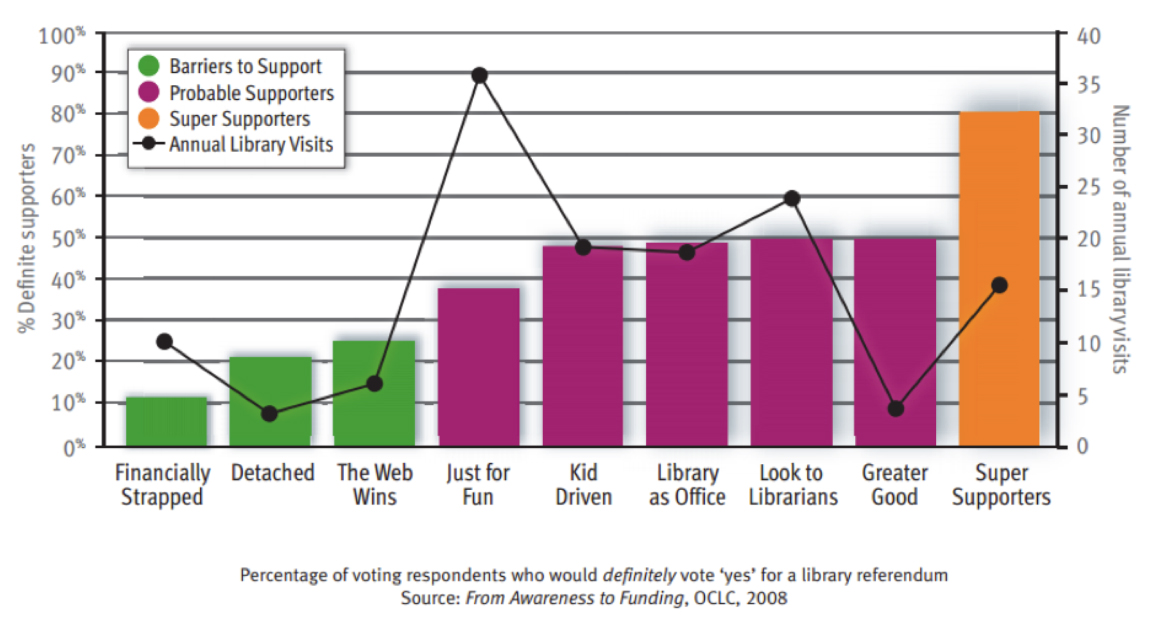
Point 3: The “Super Supporters” were twice as likely to support funding as the “Just for Fun” library users, even though the latter group visited the library twice as much as the former. For details, see Chart 3 below and Awareness to Funding, pp. 4-5 to 4-7.
Point 4: The question on this refers to “librarians” and not just the library director. This implies roles for all library staff and the need for training and job descriptions that support these roles. (From Awareness to Funding, pp. 4-8 & 4-9)
Point 5: The discussion of point 5 (pp. 4-9 to 4-12) and the next point (pp. 4-12 & 4-13) may be the two most important in the report and are imperfectly summarized here so be sure to read the original report on this.
The authors use a correspondent analysis to explore where libraries fit on a two-way grid with one axis running from “purpose” to “escape” and the other from “information” to “transformation.” They claim that public libraries are currently seen as in the quadrant which includes “information” and “purpose.” but this is being increasingly filled by other alternatives related to the internet. They claim libraries can shift to the grid “transformation” and “purpose” in both their services and branding. (From Awareness to Funding, pp. 4-9 to 4-12)
Point 6: To enhance funding, they suggest that libraries must shift their services and branding to the “transformation” and “purpose” quadrant from the “information” and “purpose” guardant.
Of the sixteen emotional or intellectual rewards that strong library supporters relate with their public library, three-quarters are on the “transformation” side of the grid rather than the “information” side currently promoted by many public libraries. Eight (50%) of the “transformational” attributes are in the quadrant with “purpose” and 4 (25%) are in the “escape” quadrant. This discussion includes a very important graphic but you will need to go the website to read it because it does not copy well. (From Awareness to Funding, pp.4-12 & 4-13)
Point 7: The authors argue that libraries are only 1 % of municipal budgets and hence there is little trade-off in expanding the library budget since such a small fraction would come from the other services. Is this conclusion correct? I personally doubt that it is since larger services are very protective of their budgets.
Point 8: This is consistent with my view in point 7, i.e. that elected leaders are responsive to those that voice strong support.
Chart 3: Visits to Library vs. Support by Voting Segment
Strengths and Weaknesses
They point out that increasingly those that vote positively want some evidence of the return on investment rather than just donating out of altruism.
While this article does not provide any suggestions on how to estimate either the private or public returns on investment it builds a strong case for doing this. This is a very interesting study with some useful insights on different segments of voters and their attitudes toward voting for library funding. While many quantitative results are presented, the authors do not describe how the same was selected, the same size and the demographic characteristics of the respondents.
