Monthly Earnings from Cash Pool Distributions
Fiscal Year 2023
| Mo. Of Earnings | Following Month Dist. | Prev. Mo. Earnings Distributed | PFM Average Historical Cost | ADVANTAGE ME Avg Daily Balance Total | Days in Mo. | Cash Pool Rate | Treasury bill (6-mo. Trailing) |
|---|---|---|---|---|---|---|---|
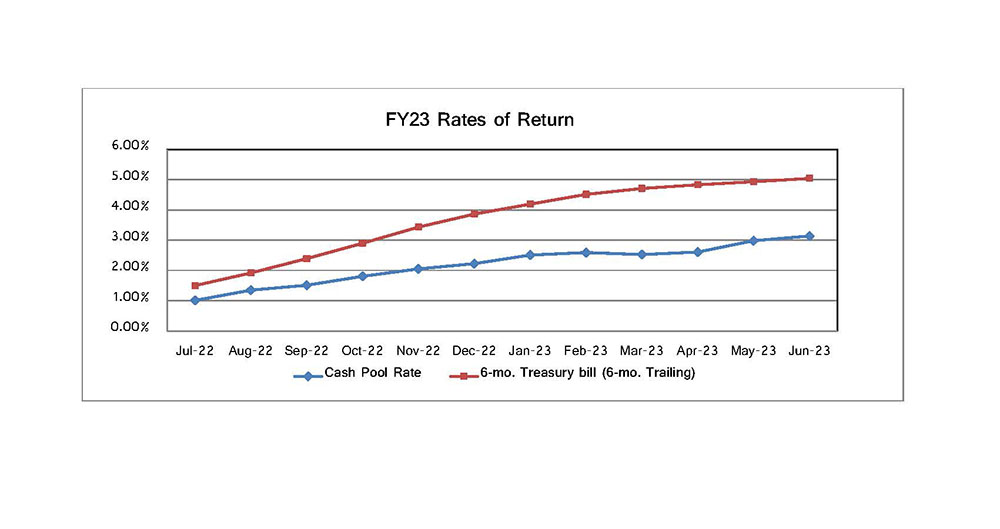
| Jul-22 | Aug-22 | $3,851,480.64 | $4,490,517,790.02 | $4,245,561,135.99 | 31 | 1.01% | 1.50% |
| Aug-22 | Sep-22 | 5,065,380.22 | 4,409,849,949.54 | 4,240,685,577.02 | 31 | 1.35% | 1.92% |
| Sep-22 | Oct-22 | 5,518,125.69 | 4,437,363,554.88 | 4,281,191,825.77 | 30 | 1.51% | 2.39% |
| Oct-22 | Nov-22 | 6,966,796.19 | 4,543,020,558.34 | 4,396,273,111.44 | 31 | 1.81% | 2.90% |
| Nov-22 | Dec-22 | 7,640,152.86 | 4,523,642,401.39 | 4,361,530,782.96 | 30 | 2.05% | 3.43% |
| Dec-22 | Jan-23 | 8,531,783.73 | 4,517,508,984.97 | 4,345,184,419.31 | 31 | 2.22% | 3.86% |
| Jan-23 | Feb-23 | 9,607,013.24 | 4,356,529,274.62 | 4,356,529,274.62 | 31 | 2.51% | 4.19% |
| Feb-23 | Mar-23 | 8,802,974.72 | 4,429,332,765.56 | 4,133,901,672.60 | 28 | 2.59% | 4.51% |
| Mar-23 | Apr-23 | 8,684,247.38 | 4,050,485,575.72 | 3,805,893,674.98 | 31 | 2.52% | 4.71% |
| Apr-23 | May-23 | 8,787,873.08 | 4,094,642,750.35 | 3,907,936,541.73 | 30 | 2.61% | 4.83% |
| May-23 | Jun-23 | 11,043,587.86 | 4,360,062,832.90 | 4,199,570,429.48 | 31 | 2.98% | 4.93% |
| Jun-23 | P12 | 11,105,849.70 | 4,304,850,015.88 | 4,109,738,409.53 | 30 | 3.14% | 5.04% |
| FY23 | Sum/Average | $95,605,265.31 | $4,389,396,935.84 | $4,198,666,404.62 | 2.19% | 3.68% |
Treasurer's Cash Pool Rates (%)
FY 2012-2023
| Month/FY | FY23 | FY22 | FY21 | FY20 | FY19 | FY18 | FY17 | FY16 | FY15 | FY14 | FY13 | FY12 |
| July | 1.01 | 0.46 | 0.77 | 2.38 | 1.65 | 1.06 | 0.73 | 0.35 | 0.3 | 0.23 | 0.35 | 0.25 |
| August | 1.35 | 0.47 | 0.73 | 2.29 | 1.74 | 1.12 | 0.72 | 0.42 | 0.4 | 0.31 | 0.26 | 0.27 |
| September | 1.51 | 0.47 | 0.73 | 2.23 | 1.84 | 1.14 | 0.75 | 0.43 | 0.35 | 0.4 | 0.27 | 0.3 |
| October | 1.81 | 0.45 | 0.69 | 2.09 | 2.04 | 1.22 | 0.79 | 0.42 | 0.28 | 0.25 | 0.28 | 0.37 |
| November | 2.05 | 0.47 | 0.67 | 1.99 | 2.15 | 1.25 | 0.81 | 0.41 | 0.35 | 0.25 | 0.31 | 0.72 |
| December | 2.22 | 0.5 | 0.71 | 1.96 | 2.15 | 1.25 | 0.82 | 0.48 | 0.33 | 0.32 | 0.26 | 0.32 |
| January | 2.51 | 0.48 | 0.69 | 1.9 | 2.24 | 1.21 | 0.84 | 0.46 | 0.43 | 0.35 | 0.23 | 0.31 |
| February | 2.59 | 0.49 | 0.63 | 1.86 | 2.3 | 1.34 | 0.86 | 0.48 | 0.41 | 0.27 | 0.26 | 0.43 |
| March | 2.52 | 0.57 | 0.67 | 1.76 | 2.3 | 1.28 | 0.87 | 0.63 | 0.49 | 0.27 | 0.35 | 0.39 |
| April | 2.61 | 0.46 | 0.69 | 1.16 | 2.39 | 1.43 | 0.97 | 0.67 | 0.37 | 0.23 | 0.26 | 0.3 |
| May | 2.98 | 0.56 | 0.57 | 0.83 | 2.42 | 1.53 | 0.96 | 0.67 | 0.41 | 0.25 | 0.37 | 0.27 |
| June | 3.14 | 0.79 | 0.5 | 0.81 | 2.42 | 1.61 | 1.05 | 0.68 | 0.36 | 0.28 | 0.27 | 0.49 |
| Average | 2.19 | 0.51 | 0.67 | 1.77 | 2.14 | 1.29 | 0.85 | 0.51 | 0.37 | 0.28 | 0.29 | 0.37 |
Historical Month-End Fund Balances (Controller's Balances)
| Fiscal Year | Month-End Balances |
|---|---|
| 2023 | Maine Ending Balances FY 2023.xlsx (MS Excel) |
| 2022 | Maine Ending Balances FY 2022.xlsx (MS Excel) |
| 2021 | Maine Ending Balances FY 2021.xlsx (MS Excel) |
| 2020 | Maine Ending Balances FY 2020.xlsx (MS Excel) |
| 2019 | Maine Ending Balances FY 2019.xlsx (MS Excel) |
| 2018 | Maine Ending Balances FY 2018.xlsx (MS Excel) |
| 2017 | Maine Ending Balances FY 2017.xlsx (MS Excel) |
| 2016 | Maine Ending Balances FY 2016.xlsx (MS Excel) |
| 2015 | Maine Ending Balances FY 2015.xlsx (MS Excel) |
| 2014 | Maine Ending Balances FY 2014.xlsx (MS Excel) |
| 2013 | Maine Ending Balances FY 2013.xlsx (MS Excel) |